
分析 Twig 模板

本篇資料來源:Profiling a Twig template | Twig in Drupal | Drupal Wiki guide on Drupal.org
翻譯:Shiuan Huang
總體設置
系統
*AMP
Git
XHProf
工具
Drupal 8 - git clone http://git.drupal.org/project/drupal.git
Drush 7 - 最新版本及最新的 Drush 安裝 install latest with drush
Cottser’s xhprof kit alias/scripts,用於 bbranch、branches 和 ubranch
XHProf Kit 安裝
詳情請參見:https://github.com/LionsAd/xhprof-kit
複製 xhprof-kit 儲存庫。在本地複製位置不重要,只要不在文件根目錄中即可。
git clone git://github.com/LionsAd/xhprof-kit.git
進入 xhprof-kit 目錄,將 xhprof 下載為 Git 子模塊:
git submodule init
git submodule update在要進行基準測試的 Drupal 目錄中,使用完整路徑在 xhprof-kit 中運行 setup-directory.sh:/full/path/to/xhprof-kit/setup-directory.sh
這會在目錄中創建 xhprof-kit 符號鏈接。
確保 Apache 配置中允許符號鏈接。127.0.0.1
目前,XHProf-Kit 假定 Drupal 安裝在 127.0.0.1 上。如果使用虛擬主機,您需要在 find-min-web.sh 中更改 URL,或導出 $XHPROF_KIT_DOCROOT 的值,例如:export XHPROF_KIT_DOCROOT="d8.dev"
XHProf Kit 別名安裝
將 xhprof-kit.sh 保存到家目錄 ~/bin/xhprof-kit.sh
確保它是可執行的:
chmod u+x ~/bin/xhprof-kit.sh
如果您已經有 API 金鑰:
更新 ubench 的 API 金鑰(如果要上傳結果):
./xhprof-kit/upload-bench.sh <strong>"APIKEY" API-IDENTIFIER</strong> $1 `git rev-parse --abbrev-ref HEAD`
最後,請在您的 ~/.bash-profile 中加入以下內容以引用您的腳本:
source ~/bin/xhprof-kit.sh 添加到文件底部。
然後打開一個新的終端窗口,測試 bbranch。
運行注意事項
禁用 XDebug(完全不加載),因為它會使速度變慢並且結果稍微不可靠(source)
關閉可能導致 CPU 或 RAM 波動的大多數程序
在 Mac 上,有一種方法是在登錄時按住 Shift 鍵,以禁用登錄項目
嘗試在進行性能分析時避免使用 Chrome
Drupal 需要位於默認站點上,以便清除緩存可正常工作(因此不要在進行性能分析時使用多個站點)
技巧和技巧
檢查您在 8.x 核心和 twig 分支之間的 ct(函數調用)是否不同
啟用 Twig 偵錯以確保在分支上使用 Twig 進行您的情景(將 $settings['twig_debug'] = TRUE; 添加到 settings.php,並查看偵錯輸出)但在收集基準之前確保禁用 twig_debug
禁用渲染緩存:將 $settings['cache']['bins']['render'] = 'cache.backend.null'; 添加到 settings.php
目前,前兩個步驟在文件 sites/example.settings.local.php 中。然後打開一個新的終端窗口,測試 bbranch
運行 bbranch 幾次,以使測試和 CPU 都達到穩定狀態,這似乎能提供與 8.x 的基準相比更準確的結果
在切換分支且啟用/禁用 Twig 偵錯時,使用 $ drush cr 清除緩存,以使更改生效。
Twig 分析
為了能夠上傳結果以供他人查看,請在 IRC 上聯繫 @Fabianx 獲取 API 金鑰。
推薦的性能分析工作流程
在 settings.php 中啟用 APC 類別加載器。
創建問題分支 - 從 8.x 創建一個新的分支以測試有問題的補丁,例如 user-1898468-91,並在該分支中提交 Twig 轉換補丁(例如 git apply --index user-1898468-91.patch; git commit -m "apply patch")。
設置 Drupal 首頁 - 由於性能分析僅查看站點首頁,您需要設置本地 Drupal 站點以在首頁上顯示適當的頁面,並確保匿名用戶可以看到它。如果不可能,或者如果您更喜歡,您可以直接在 xhprof-kit 中的 find-min-web.sh 中編輯 URL。
將匿名角色設置為具有所有權限。
查看相應的問題,以確定如何在站點上的某個頁面上複製問題。
將首頁設置為 Site Information (/admin/config/system/site-information) 上的正確 URL - 或使用:drush cset system.site page.front "path/goes/here")
例如:如果您正在測試 user.tpl.php 轉換為 Twig user.tpl.php conversion to Twig,則允許匿名用戶查看用戶配置文件,並將首頁設置為 user/1。
運行性能分析
繼續使用 user.tpl.php 分析的範例,我們有一個帶有 Twig 轉換提交的 user-1898468-91 分支 user.tpl.php profiling,並且情境已經設置,以便匿名用戶可以在首頁上查看它(啟用 Stark 主題,並在頁面上某處呈現 Twig 模板,例如節點或用戶配置文件)。一旦所有這些都準備好:
切換到 8.x:git checkout 8.0.x
運行 bbranch
您應該會得到以下輸出:
loop time: |0.345511s|51978cc86c728|drupal-perf|8.x|<a href="http://d8prof.dev/xhprof-kit/xhprof/xhprof_html/index.php?source=drupal-perf&url=%2F&run=51978cc86c728&extra=8.x" target="_blank">Profiler output</a>
從 bbranch 複製 XHProf 運行 ID,例如 51978cc86c728
運行 bbranches 51978cc86c728 user-1898468-91 以比較當前分支(8.x)與 Twig 轉換分支。請注意,命令現在是 bbranches,而不是 bbranch。
一旦運行完成,您應該會得到如下內容:
=== 8.x..8.x compared (51978cc86c728..51978d2b1f3d1): ct : 33,570|33,570|0|0.0% wt : 345,567|345,166|-401|-0.1% cpu : 315,116|314,178|-938|-0.3% mu : 30,324,000|30,324,000|0|0.0% pmu : 30,433,448|30,433,448|0|0.0% <a href="http://d8prof.dev/xhprof-kit/xhprof/xhprof_html/index.php?source=drupal-perf&url=%2F&run1=51978cc86c728&run2=51978d2b1f3d1&extra=8.x..8.x">Profiler output</a> === 8.x..user-1898468-91 compared (51978cc86c728..51978d4d92dd9): ct : 33,570|33,703|133|0.4% wt : 345,567|345,816|249|0.1% cpu : 315,116|314,995|-121|-0.0% mu : 30,324,000|30,345,720|21,720|0.1% pmu : 30,433,448|30,456,824|23,376|0.1% <a href="http://d8prof.dev/xhprof-kit/xhprof/xhprof_html/index.php?source=drupal-perf&url=%2F&run1=51978cc86c728&run2=51978d4d92dd9&extra=8.x..user-1898468-91">Profiler output</a>
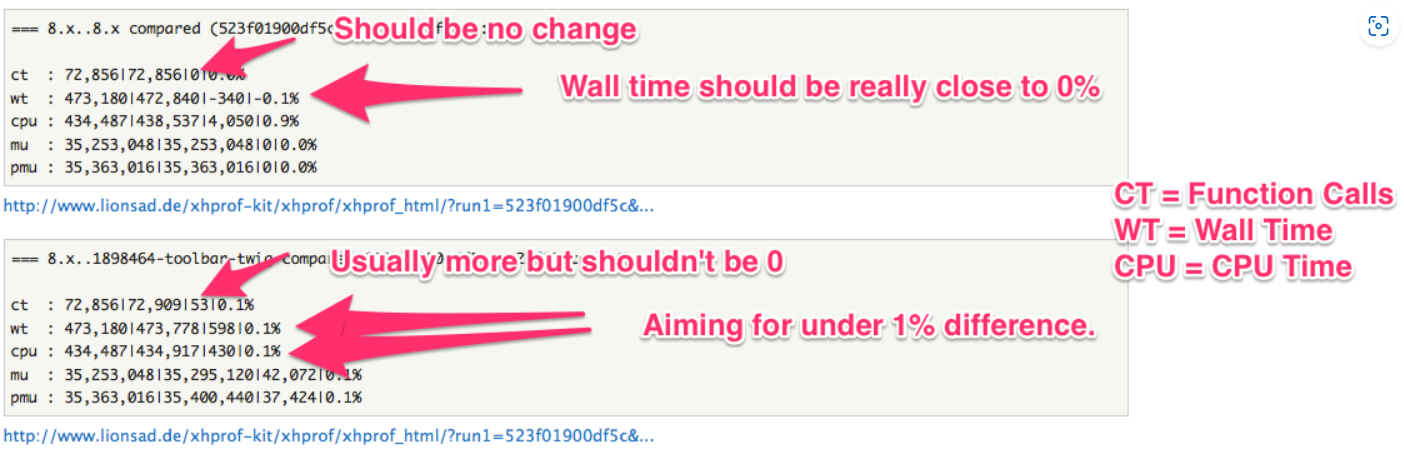
於第一個 8.x..8.x 比較,我們不希望 wt 波動太大 - 這是我們的比較基準,以顯示 bbranch 的第一個運行仍然準確,因為它用於與這兩個新運行進行比較。您可能需要多次執行此過程(運行 bbranch,獲取運行 ID,使用新運行 ID 運行 bbranches)來獲得低 wt 波動,通常我們希望在 +–0.5% 以下,但更小則更好。不要浪費一整天試圖獲得 0% 的波動 :)
發布結果
一旦您對比後較滿意(並且您從 @Fabianx 那裡獲得了 API 金鑰),您可以運行:
ubench 51978cc86c728
其中 51978cc86c728 是用於比較的基準運行,最初來自 bbranch。
然後,您將得到如下輸出:
Run 51978cc86c728 uploaded successfully for drupal-perf-cottser. Run 51978d2b1f3d1 uploaded successfully for drupal-perf-cottser. === 8.x..8.x compared (51978cc86c728..51978d2b1f3d1): ct : 33,570|33,570|0|0.0% wt : 345,567|345,166|-401|-0.1% cpu : 315,116|314,178|-938|-0.3% mu : 30,324,000|30,324,000|0|0.0% pmu : 30,433,448|30,433,448|0|0.0% http://www.lionsad.de/xhprof-kit/xhprof/xhprof_html/?run1=51978cc86c728&run2=51978d2b1f3d1&source=drupal-perf-cottser&extra=8.x..8.x Run 51978cc86c728 uploaded successfully for drupal-perf-cottser. Run 51978d4d92dd9 uploaded successfully for drupal-perf-cottser. === 8.x..user-1898468-91 compared (51978cc86c728..51978d4d92dd9): ct : 33,570|33,703|133|0.4% wt : 345,567|345,816|249|0.1% cpu : 315,116|314,995|-121|-0.0% mu : 30,324,000|30,345,720|21,720|0.1% pmu : 30,433,448|30,456,824|23,376|0.1% http://www.lionsad.de/xhprof-kit/xhprof/xhprof_html/?run1=51978cc86c728&run2=51978d4d92dd9&source=drupal-perf-cottser&extra=8.x..user-1898468-91
注意事項
另一種方法
@claudiu.cristea 採用了一種不同的方法,使用了 jmeter。您可以參考這個方法,並嘗試進行測試。這裡有一個針對圖片模組轉換的性能測試的優秀範例:
http://webikon.com/cases/drupal-twig-conversion-performance-test-with-jm...

分析 Twig 模板
本篇資料來源:Profiling a Twig template | Twig in Drupal | Drupal Wiki guide on Drupal.org
翻譯:Shiuan Huang
總體設置
系統
*AMP
Git
XHProf
工具
Drupal 8 - git clone http://git.drupal.org/project/drupal.git
Drush 7 - 最新版本及最新的 Drush 安裝 install latest with drush
Cottser’s xhprof kit alias/scripts,用於 bbranch、branches 和 ubranch
XHProf Kit 安裝
詳情請參見:https://github.com/LionsAd/xhprof-kit
複製 xhprof-kit 儲存庫。在本地複製位置不重要,只要不在文件根目錄中即可。
git clone git://github.com/LionsAd/xhprof-kit.git
進入 xhprof-kit 目錄,將 xhprof 下載為 Git 子模塊:
git submodule init
git submodule update在要進行基準測試的 Drupal 目錄中,使用完整路徑在 xhprof-kit 中運行 setup-directory.sh:/full/path/to/xhprof-kit/setup-directory.sh
這會在目錄中創建 xhprof-kit 符號鏈接。
確保 Apache 配置中允許符號鏈接。127.0.0.1
目前,XHProf-Kit 假定 Drupal 安裝在 127.0.0.1 上。如果使用虛擬主機,您需要在 find-min-web.sh 中更改 URL,或導出 $XHPROF_KIT_DOCROOT 的值,例如:export XHPROF_KIT_DOCROOT="d8.dev"
XHProf Kit 別名安裝
將 xhprof-kit.sh 保存到家目錄 ~/bin/xhprof-kit.sh
確保它是可執行的:
chmod u+x ~/bin/xhprof-kit.sh
如果您已經有 API 金鑰:
更新 ubench 的 API 金鑰(如果要上傳結果):
./xhprof-kit/upload-bench.sh <strong>"APIKEY" API-IDENTIFIER</strong> $1 `git rev-parse --abbrev-ref HEAD`
最後,請在您的 ~/.bash-profile 中加入以下內容以引用您的腳本:
source ~/bin/xhprof-kit.sh 添加到文件底部。
然後打開一個新的終端窗口,測試 bbranch。
運行注意事項
禁用 XDebug(完全不加載),因為它會使速度變慢並且結果稍微不可靠(source)
關閉可能導致 CPU 或 RAM 波動的大多數程序
在 Mac 上,有一種方法是在登錄時按住 Shift 鍵,以禁用登錄項目
嘗試在進行性能分析時避免使用 Chrome
Drupal 需要位於默認站點上,以便清除緩存可正常工作(因此不要在進行性能分析時使用多個站點)
技巧和技巧
檢查您在 8.x 核心和 twig 分支之間的 ct(函數調用)是否不同
啟用 Twig 偵錯以確保在分支上使用 Twig 進行您的情景(將 $settings['twig_debug'] = TRUE; 添加到 settings.php,並查看偵錯輸出)但在收集基準之前確保禁用 twig_debug
禁用渲染緩存:將 $settings['cache']['bins']['render'] = 'cache.backend.null'; 添加到 settings.php
目前,前兩個步驟在文件 sites/example.settings.local.php 中。然後打開一個新的終端窗口,測試 bbranch
運行 bbranch 幾次,以使測試和 CPU 都達到穩定狀態,這似乎能提供與 8.x 的基準相比更準確的結果
在切換分支且啟用/禁用 Twig 偵錯時,使用 $ drush cr 清除緩存,以使更改生效。
Twig 分析
為了能夠上傳結果以供他人查看,請在 IRC 上聯繫 @Fabianx 獲取 API 金鑰。
推薦的性能分析工作流程
在 settings.php 中啟用 APC 類別加載器。
創建問題分支 - 從 8.x 創建一個新的分支以測試有問題的補丁,例如 user-1898468-91,並在該分支中提交 Twig 轉換補丁(例如 git apply --index user-1898468-91.patch; git commit -m "apply patch")。
設置 Drupal 首頁 - 由於性能分析僅查看站點首頁,您需要設置本地 Drupal 站點以在首頁上顯示適當的頁面,並確保匿名用戶可以看到它。如果不可能,或者如果您更喜歡,您可以直接在 xhprof-kit 中的 find-min-web.sh 中編輯 URL。
將匿名角色設置為具有所有權限。
查看相應的問題,以確定如何在站點上的某個頁面上複製問題。
將首頁設置為 Site Information (/admin/config/system/site-information) 上的正確 URL - 或使用:drush cset system.site page.front "path/goes/here")
例如:如果您正在測試 user.tpl.php 轉換為 Twig user.tpl.php conversion to Twig,則允許匿名用戶查看用戶配置文件,並將首頁設置為 user/1。
運行性能分析
繼續使用 user.tpl.php 分析的範例,我們有一個帶有 Twig 轉換提交的 user-1898468-91 分支 user.tpl.php profiling,並且情境已經設置,以便匿名用戶可以在首頁上查看它(啟用 Stark 主題,並在頁面上某處呈現 Twig 模板,例如節點或用戶配置文件)。一旦所有這些都準備好:
切換到 8.x:git checkout 8.0.x
運行 bbranch
您應該會得到以下輸出:
loop time: |0.345511s|51978cc86c728|drupal-perf|8.x|<a href="http://d8prof.dev/xhprof-kit/xhprof/xhprof_html/index.php?source=drupal-perf&url=%2F&run=51978cc86c728&extra=8.x" target="_blank">Profiler output</a>
從 bbranch 複製 XHProf 運行 ID,例如 51978cc86c728
運行 bbranches 51978cc86c728 user-1898468-91 以比較當前分支(8.x)與 Twig 轉換分支。請注意,命令現在是 bbranches,而不是 bbranch。
一旦運行完成,您應該會得到如下內容:
=== 8.x..8.x compared (51978cc86c728..51978d2b1f3d1): ct : 33,570|33,570|0|0.0% wt : 345,567|345,166|-401|-0.1% cpu : 315,116|314,178|-938|-0.3% mu : 30,324,000|30,324,000|0|0.0% pmu : 30,433,448|30,433,448|0|0.0% <a href="http://d8prof.dev/xhprof-kit/xhprof/xhprof_html/index.php?source=drupal-perf&url=%2F&run1=51978cc86c728&run2=51978d2b1f3d1&extra=8.x..8.x">Profiler output</a> === 8.x..user-1898468-91 compared (51978cc86c728..51978d4d92dd9): ct : 33,570|33,703|133|0.4% wt : 345,567|345,816|249|0.1% cpu : 315,116|314,995|-121|-0.0% mu : 30,324,000|30,345,720|21,720|0.1% pmu : 30,433,448|30,456,824|23,376|0.1% <a href="http://d8prof.dev/xhprof-kit/xhprof/xhprof_html/index.php?source=drupal-perf&url=%2F&run1=51978cc86c728&run2=51978d4d92dd9&extra=8.x..user-1898468-91">Profiler output</a>
於第一個 8.x..8.x 比較,我們不希望 wt 波動太大 - 這是我們的比較基準,以顯示 bbranch 的第一個運行仍然準確,因為它用於與這兩個新運行進行比較。您可能需要多次執行此過程(運行 bbranch,獲取運行 ID,使用新運行 ID 運行 bbranches)來獲得低 wt 波動,通常我們希望在 +–0.5% 以下,但更小則更好。不要浪費一整天試圖獲得 0% 的波動 :)
發布結果
一旦您對比後較滿意(並且您從 @Fabianx 那裡獲得了 API 金鑰),您可以運行:
ubench 51978cc86c728
其中 51978cc86c728 是用於比較的基準運行,最初來自 bbranch。
然後,您將得到如下輸出:
Run 51978cc86c728 uploaded successfully for drupal-perf-cottser. Run 51978d2b1f3d1 uploaded successfully for drupal-perf-cottser. === 8.x..8.x compared (51978cc86c728..51978d2b1f3d1): ct : 33,570|33,570|0|0.0% wt : 345,567|345,166|-401|-0.1% cpu : 315,116|314,178|-938|-0.3% mu : 30,324,000|30,324,000|0|0.0% pmu : 30,433,448|30,433,448|0|0.0% http://www.lionsad.de/xhprof-kit/xhprof/xhprof_html/?run1=51978cc86c728&run2=51978d2b1f3d1&source=drupal-perf-cottser&extra=8.x..8.x Run 51978cc86c728 uploaded successfully for drupal-perf-cottser. Run 51978d4d92dd9 uploaded successfully for drupal-perf-cottser. === 8.x..user-1898468-91 compared (51978cc86c728..51978d4d92dd9): ct : 33,570|33,703|133|0.4% wt : 345,567|345,816|249|0.1% cpu : 315,116|314,995|-121|-0.0% mu : 30,324,000|30,345,720|21,720|0.1% pmu : 30,433,448|30,456,824|23,376|0.1% http://www.lionsad.de/xhprof-kit/xhprof/xhprof_html/?run1=51978cc86c728&run2=51978d4d92dd9&source=drupal-perf-cottser&extra=8.x..user-1898468-91
注意事項
另一種方法
@claudiu.cristea 採用了一種不同的方法,使用了 jmeter。您可以參考這個方法,並嘗試進行測試。這裡有一個針對圖片模組轉換的性能測試的優秀範例:
http://webikon.com/cases/drupal-twig-conversion-performance-test-with-jm...